Not 'is the box hot', but 'which function is hot'. OpenTelemetry profiling is continuous, whole-system profiling as observability's fourth signal, so you can see the exact code burning your CPU in production.
It is 3am and every signal you have agrees on the same unhelpful thing. Metrics say CPU is pinned. Logs say the service is busy. Traces say the request is slow. Not one of them tells you which line of code is doing it. That gap is what profiling fills, and in 2026 it stopped being a vendor add-on and started becoming a standard.
What is OpenTelemetry profiling?
A profile is a statistical sample of what your code is actually doing, rolled up into a flame graph where the widest bar is the hottest path. Profiling answers the one question the other three signals cannot: which exact function, running right now in production, is using your CPU or your time.
OpenTelemetry, the open standard for telemetry, has added profiling as its fourth signal, alongside logs, metrics and traces. The signal entered public alpha on 25 March 2026, with beta and general availability still to come and no date committed yet. The reference implementation is an eBPF-based profiler donated by Elastic and now maintained in the open as the OpenTelemetry eBPF profiler.
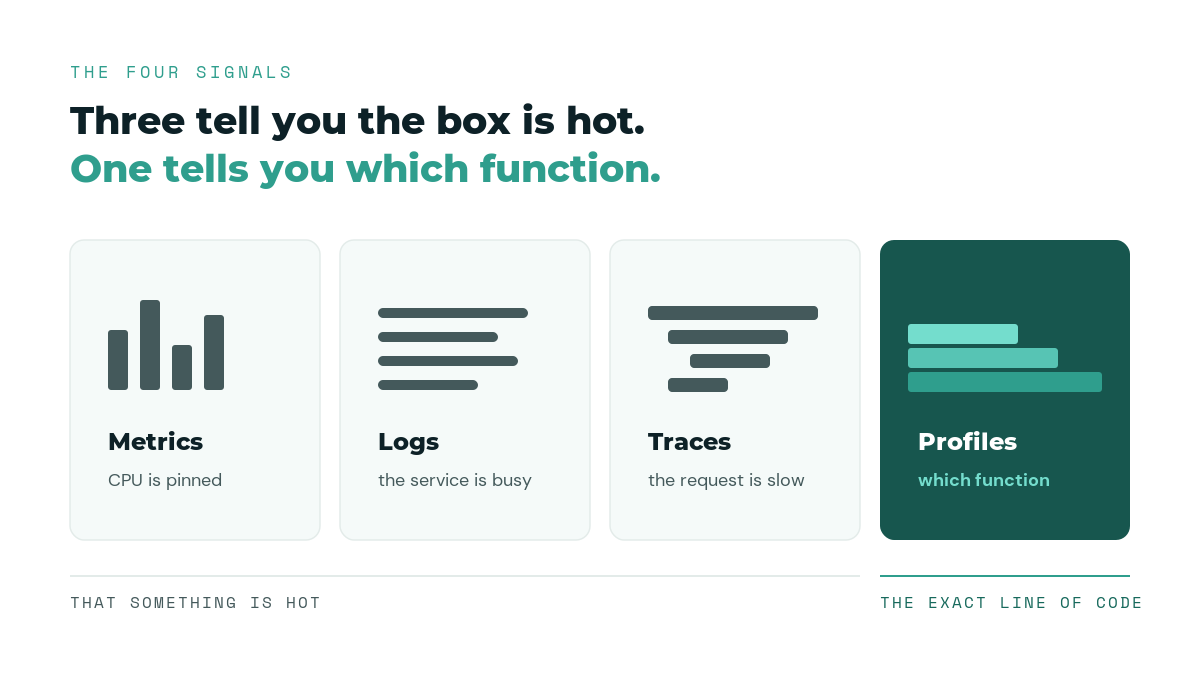
Three signals tell you the box is hot. Profiling, the fourth, tells you which function.
Continuous, not just on demand
Traditional profiling was something you switched on for a few minutes once you already had a problem, usually on a laptop, rarely in production. Continuous profiling flips that. It runs always-on, in production, at a low sample rate, so when the bad night comes the evidence is already there. You do not reproduce the incident to profile it. You scroll back to it.
The OpenTelemetry profiler does this with eBPF, a way to run safe, sandboxed programs inside the Linux kernel. Because it reads from the kernel, one agent profiles every process on the box, across languages, with no code changes and no restarts.
What it does well
Whole-system, zero instrumentation. One agent profiles everything on the host, from the kernel up through Go, Python, Java, .NET, Ruby, Node and more, with no code changes and no restarts.
It speaks the standard. Profiles are exported in OTLP, the same wire format as the rest of your OpenTelemetry data, so they land in the pipeline you already run instead of a proprietary silo.
It lines up with your traces. Profile samples can carry the trace and span IDs, so you can go from a slow trace straight to the flame graph of the exact code that made it slow. That link between the trace and the profile is the payoff.
It runs as a Collector receiver. The profiler slots into the OpenTelemetry Collector you may already run, rather than standing up a separate stack.
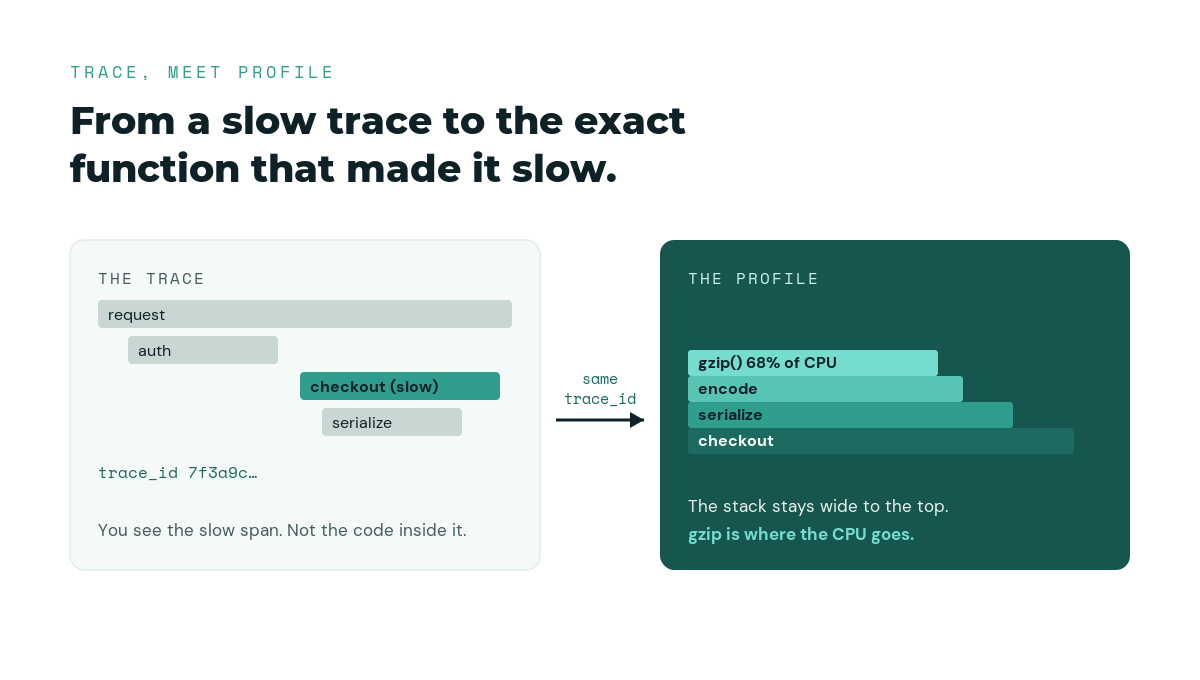
The trace shows the slow span. The profile, linked by the same trace_id, shows the function inside it burning the CPU.
The honest ledger
This is where the byline earns its keep. Profiling is genuinely useful and genuinely early.
It is alpha. The signal is public alpha, not GA. The spec and the tooling are still moving, so pilot it, do not bet a production SLA on it today.
Always-on data has a real cost. Continuous profiling produces a lot of data. Storage and cardinality are not free, and "profile everything forever" is exactly how you build the next observability bill nobody can explain.
Symbolisation is uneven. Turning raw addresses into readable function names works well for some runtimes and is still catching up for others.
It needs kernel-level access. eBPF is safe by design, but it is privileged, so it has to clear the same security and platform review as any agent that reads from the kernel.
So, is it right for you?
It fits if you have a hot path that keeps hurting and the other three signals keep telling you the box is busy without telling you why, or if you are carrying a CPU or latency mystery you cannot reproduce on demand. Turn it on where the pain is, line the flame graph up against the trace, and you will usually find the function faster than you would by reading code.
Hold off if you need a production-stable, GA-supported signal right now, or if your existing signals already answer your questions and you would just be adding always-on data, and cost, for a problem you do not have.
For the leaders reading this, one line to take away: this is where the cost story hides. The same always-on profiling that finds your hot function is a new stream of data to store, so decide up front where you switch it on and how long you keep it.
OpenTelemetry profiling is the fourth signal: the one that stops telling you the box is hot and starts telling you which function made it that way.
Get the next one One signal a week. No noise. | |
If this was useful, Metrics & Mayhem sends one short, practical piece like it to IT operations leaders most weeks. No fluff, no vendor noise.
Prefer to start with the book? Read a free chapter. |